
Ten Myths That Slow Down Solana Applications: Why a Fast Setup Can Still Be Slow
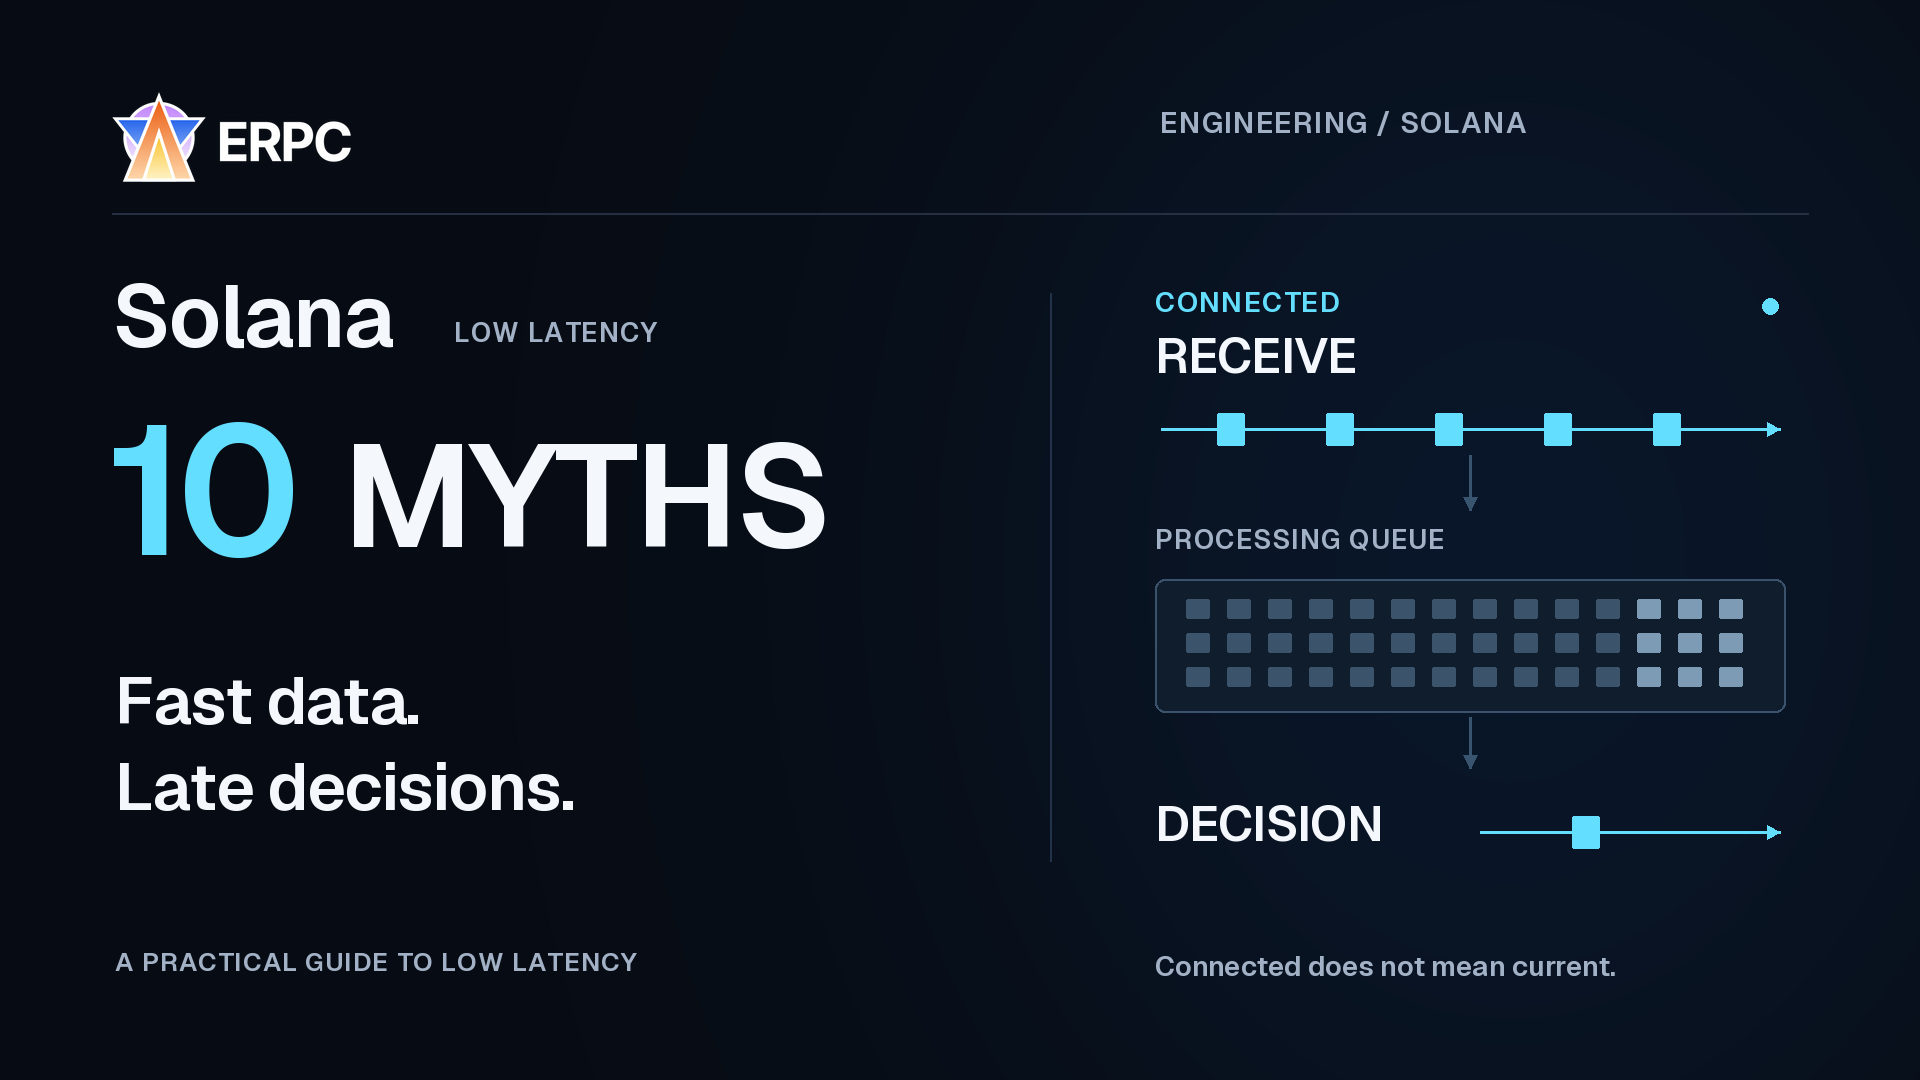
Your connection is fast. Your CPU is modern. Your server is in the same city as the data provider. Yet your application is still slow to react to the information it needs. The connection stays open, but the data being processed gradually falls further behind.
When building low-latency applications on Solana, this situation does not always have a single cause. Network routing, receive settings, the data you subscribe to, and waiting inside the application can combine to prevent you from making full use of the fast infrastructure you selected.
At ERPC, operated by ELSOUL LABO B.V., our support team repeatedly encounters questions about stalled receive loops, client settings, unnecessarily broad subscriptions, and reconnection attempts that leave the original error unresolved. Choices that caused little trouble in a conventional web application can become constraints in high-frequency trading and real-time processing.
This article examines ten myths behind these problems. The aim is to help you assess both your choice of infrastructure and the design that carries its performance through to decisions and transaction submission.
First, decide what must finish sooner
Network round-trip time, data arrival time, decision time, and the time until a transaction is confirmed are different metrics. A fast ping cannot prevent slow decisions if processing stalls after receipt. A quick RPC response does not necessarily mean that the transaction has executed.
Start by defining your objective, such as the time from observing a target event to completing the necessary decision and submitting a transaction. Then measure observation, processing after receipt, and submission and confirmation separately. Improvement begins by refusing to reduce speed to a single product name or number.
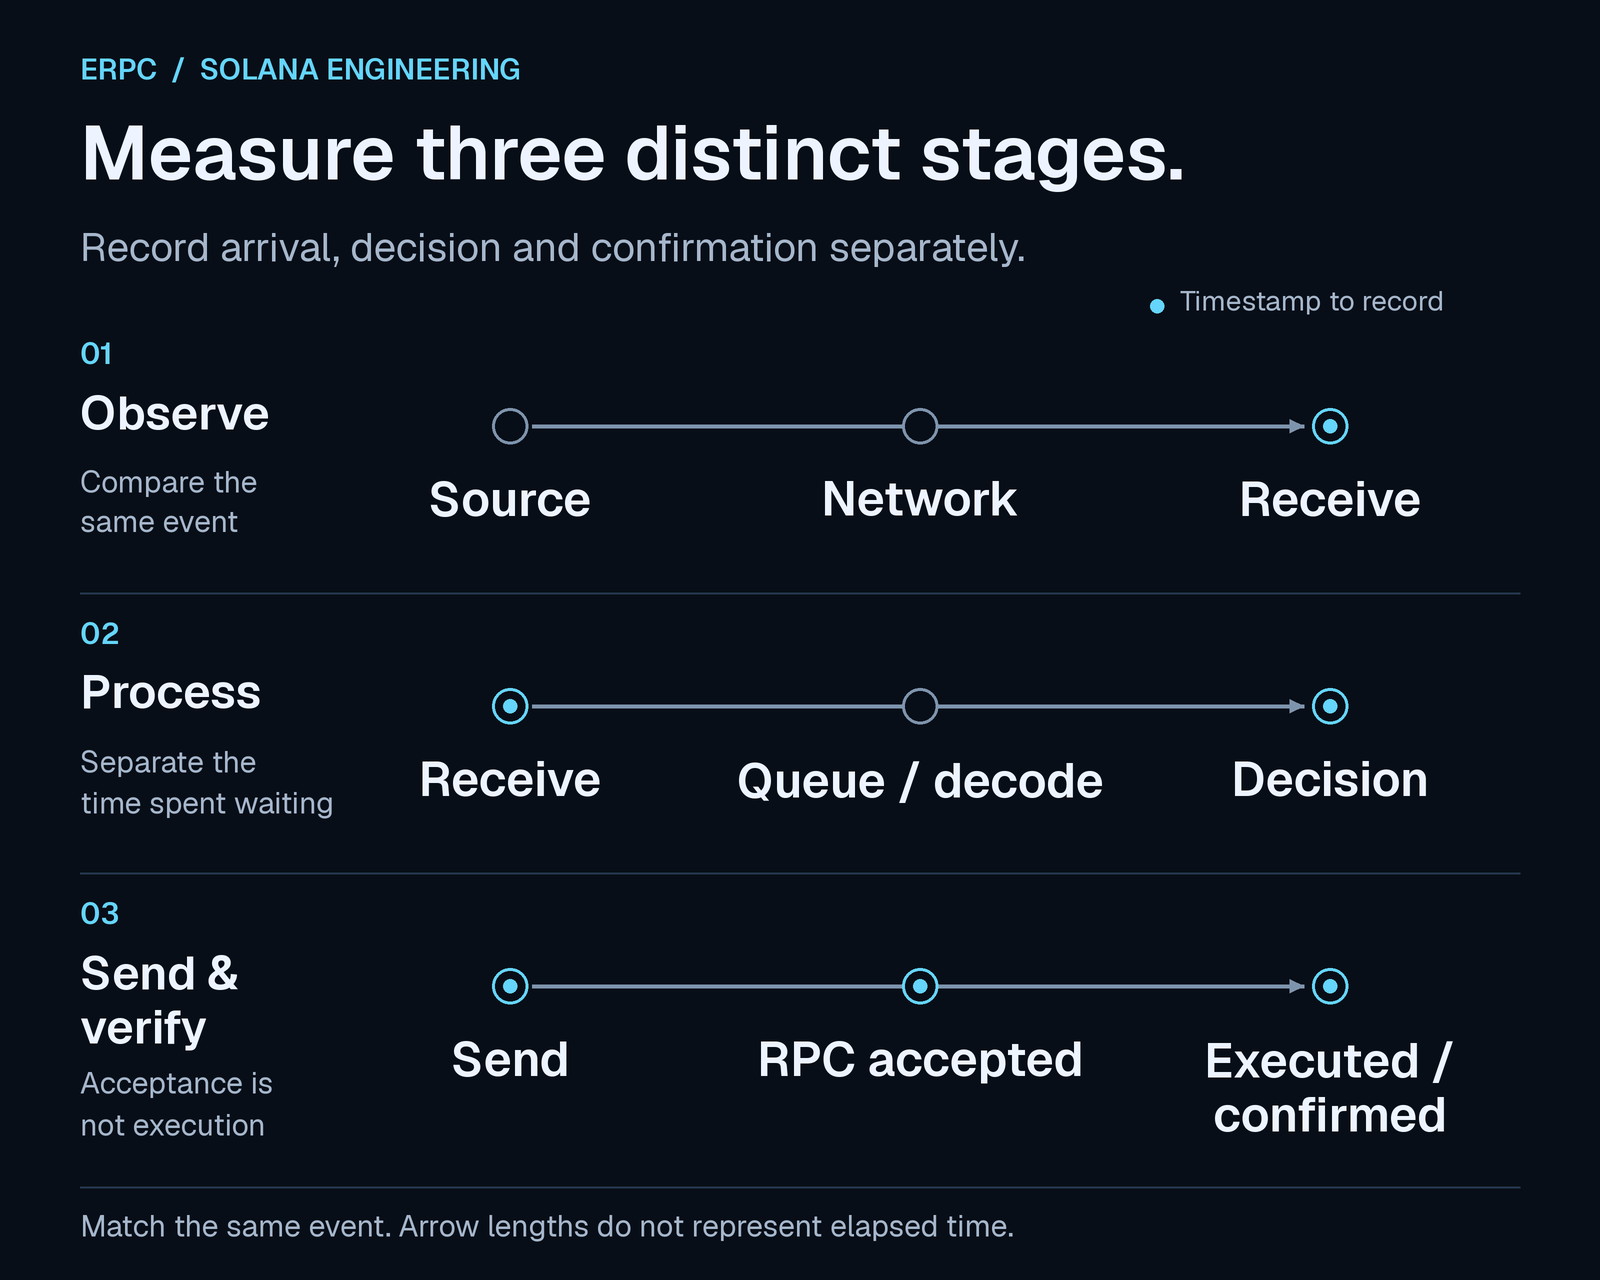
This diagram illustrates measurement stages. It does not represent measured durations or performance differences between stages.
Myth 1: A small VM is running, so it must have enough capacity
A small cloud VM worked well for an earlier web application or an Ethereum workload. That experience can make it tempting to assume the same configuration will handle a Solana stream. But an application making occasional RPC queries and one continuously receiving and processing a broad range of updates need different resources.
Size the environment for data volume, arrival rate, work per event, and acceptable latency. How many events arrive each second? How many bytes are transferred? How much CPU time and memory do decoding and decisions consume? Allow headroom to keep up during bursts as well as ordinary traffic. Even on the same chain, subscription scope and implementation change the requirements.
The difficult part is that an underprovisioned application can appear to be working. Data may keep appearing on screen while it becomes increasingly stale, or gaps during reconnection may go undetected. Received-event counts alone cannot reveal this. Check completed-event counts, the age of unprocessed data, and continuity of the events your subscription should cover.
If earlier experience is the only reference point, developers may never question receive-side capacity and continue to blame the data endpoint. Trying an environment with more headroom can expose backlog or missing data that was not previously apparent.
To investigate, compare the same endpoint, subscription, commitment, SDK and settings, and processing workload on a receive-and-process environment with more headroom. Keep the region consistent, record differences in CPU, memory, and networking, and compare receive throughput, completed work, backlog, missing events, and time to a decision. Workload varies over time, so compare during the same period where possible, while respecting connection limits and the load placed on the service.
An improvement after changing the environment shows that receive-side or processing conditions contributed to the result. If CPU, memory, and networking changed together, further checks are needed to identify which resource mattered. Choosing resources for the amount and rate of data actually handled is a prerequisite for low-latency processing.
Myth 2: Being in the same city means being close on the network
“Both servers are in Frankfurt, so they must be close.” “Deploying in Tokyo must be fastest for Japan.” City names help you consider deployment locations, but they do not guarantee the actual route your traffic will take.
The path depends on connections between data centers, connections between network operators, and routing decisions. Even servers in the same city may take an indirect route through external networks. RIPE IPmap, for example, identifies the visualization of routing inefficiencies, such as traffic leaving a country and then returning, as one of its uses. [1]
Measure RTT between the actual data source and the host running your application, variation over time, retransmissions or loss, and the arrival time of the same event. Traceroute and MTR can help investigate the path, but hop count alone cannot determine which route is better. It is also important not to mistake an intermediate router limiting its diagnostic responses for packet loss affecting the application.
After choosing a region, ask one further question: how are this particular data source and this particular server actually connected? That additional check reveals differences that a city name alone cannot tell you.
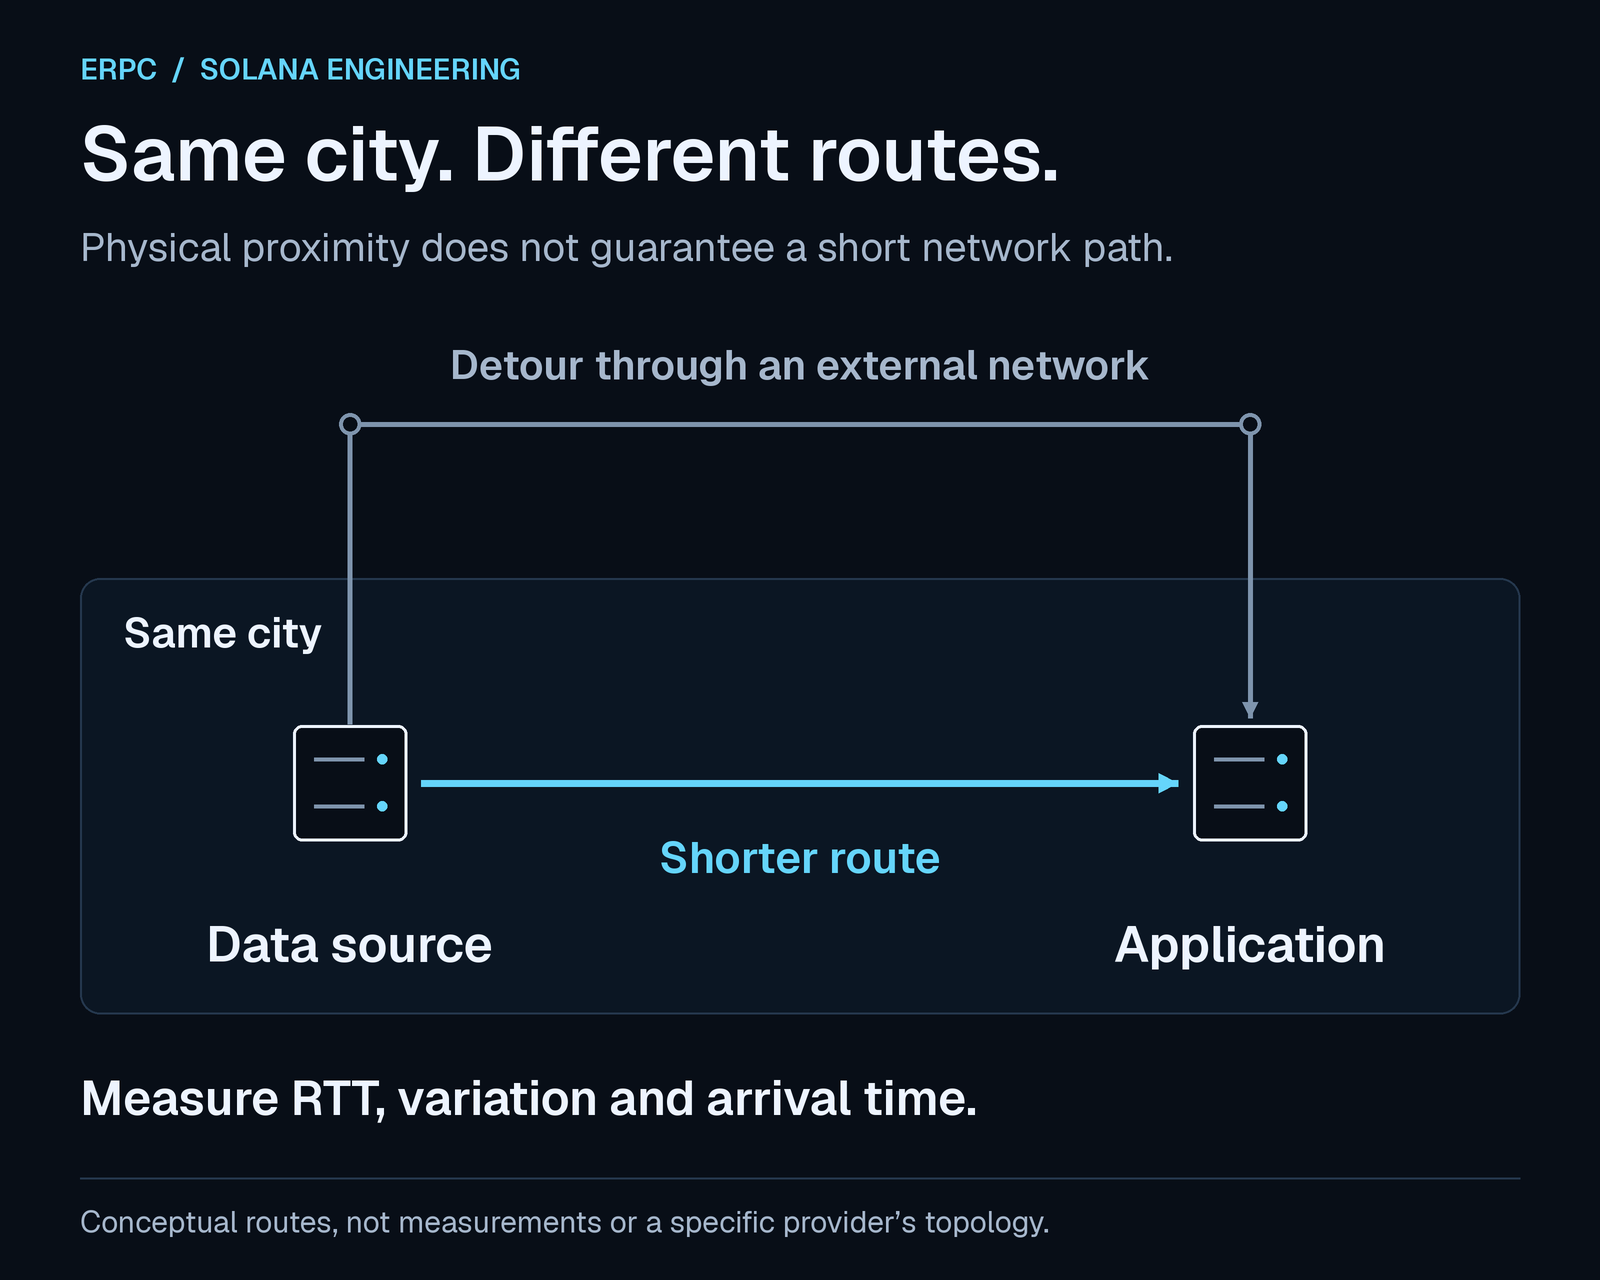
This diagram explains a routing difference. It does not depict the actual network of any particular provider.
Myth 3: A high network specification means enough usable bandwidth
Bandwidth in a server specification can mean several things: physical port speed, bandwidth allocated to a virtual machine, sustained bandwidth, or a temporary burst limit. Having a fast NIC does not mean your application can continuously use all of its capacity.
AWS documentation, for example, distinguishes baseline bandwidth from burst bandwidth and describes constraints involving traffic destinations, flows, and packet rates. This illustrates how to read a specification; it does not mean every VPS has the same limits as AWS. [2]
When choosing a plan, check whether bandwidth is dedicated or shared, the conditions for sustained use, transfer allowances, and whether different traffic destinations are treated differently. During testing, maintain traffic to the same endpoint with the same subscription conditions you intend to use in production, while observing receive throughput, drops, retransmissions, and CPU load together.
A high result in a short speed test does not prove that the server can continuously process a production stream. At the same time, low receive throughput does not necessarily mean insufficient bandwidth. Separate receive-setting issues and processing limitations before upgrading the connection.
Myth 4: A better CPU model, more cores, or higher maximum GHz makes the application fast
A CPU's maximum boost frequency is not a clock speed it maintains under every workload. Actual operation depends on power, temperature, firmware, frequency controls, and other workloads. Linux documentation explains that enabling boost permits its use; it does not show that the CPU is actually boosting. [3]
If important work is concentrated in one thread, adding cores alone will not make that work finish sooner. Overall CPU utilization can look low while a single core or event loop is saturated. The Node.js official guide also explains how a heavy callback makes other work wait. [4]
Check clock frequency, temperature, per-core utilization, and processing times under your actual workload. In a virtual environment, time spent waiting for CPU allocation can also be informative. Profile the application to find how much time goes into decoding, computation, memory allocation, and logging.
Choose a combination of CPU clock performance, resource allocation, settings that sustain performance, and application implementation. Comparing model numbers alone cannot establish how fast the whole application will run.
Myth 5: With gRPC, the client's default settings are sufficient
Establishing a gRPC connection does not prove that it can receive the required volume of data at the required speed. HTTP/2 has flow control through which the receiver tells the sender how much data it can accept. Control applies at both stream and connection level, so receive windows and their updates can constrain throughput even when the network link has spare capacity. [5][6]
A receive window tells the sender how much data it may send without another update from the receiver. Initial values, automatic adjustment, and setting precedence differ between SDKs and libraries. Writing a large number in a configuration file does not establish that the client behaves as intended. Check both stream and connection settings, how they interact with adaptive settings, and the version in use.
Make changes while measuring actual receive throughput and processing backlog under the same subscription conditions. Maximum receive message size, the TCP receive buffer, and the HTTP/2 receive window are separate settings. Keepalive checks connection liveness; it does not add processing capacity or bandwidth.
The ERPC gRPC FAQ includes troubleshooting steps and client configuration examples for a stream whose throughput stays flat while it falls behind. Use the examples as a starting point, then verify them against your own subscription volume and processing capacity. [7]
Myth 6: Receiving every full block leads to the earliest decisions
“Receive everything first, then find what matters.” This is an understandable way to begin development, but it adds work that may not be needed before a decision. Transferring, decoding, allocating memory for, and searching unnecessary data all consume finite bandwidth and CPU resources.
If you want to react to changes in a particular market, program, or account, define the events and fields required for the decision first. Yellowstone gRPC provides transaction and account subscription filters, as well as a way to retrieve only part of account data. Notifications for complete blocks and notifications for individual updates are also different things. [8]
With the same resources and conditions, if one application waits to expand and search all records while another can process the necessary update immediately, the second application avoids that waiting time. A more focused competitor may repeatedly react first for reasons beyond the network connection. Deciding what can be ignored is part of low-latency design.
Indexing, auditing, research, and historical storage may legitimately require all data. Provide a separate path for that workload. Separating it from immediate decision-making lets you design the capacity and completeness each path needs. Verify, however, that filtering has not removed updates necessary for correct decisions. Batching can also increase total throughput in some cases, so choose it according to the waiting time your application can tolerate.
On ERPC's current Shared gRPC service, a non-empty
blocks subscription requires Dedicated service. transactions subscriptions or blocksMeta may meet a particular need, but neither provides the same data as full blocks. Choosing Dedicated service still requires suitable receive-side processing capacity and subscription design. [9]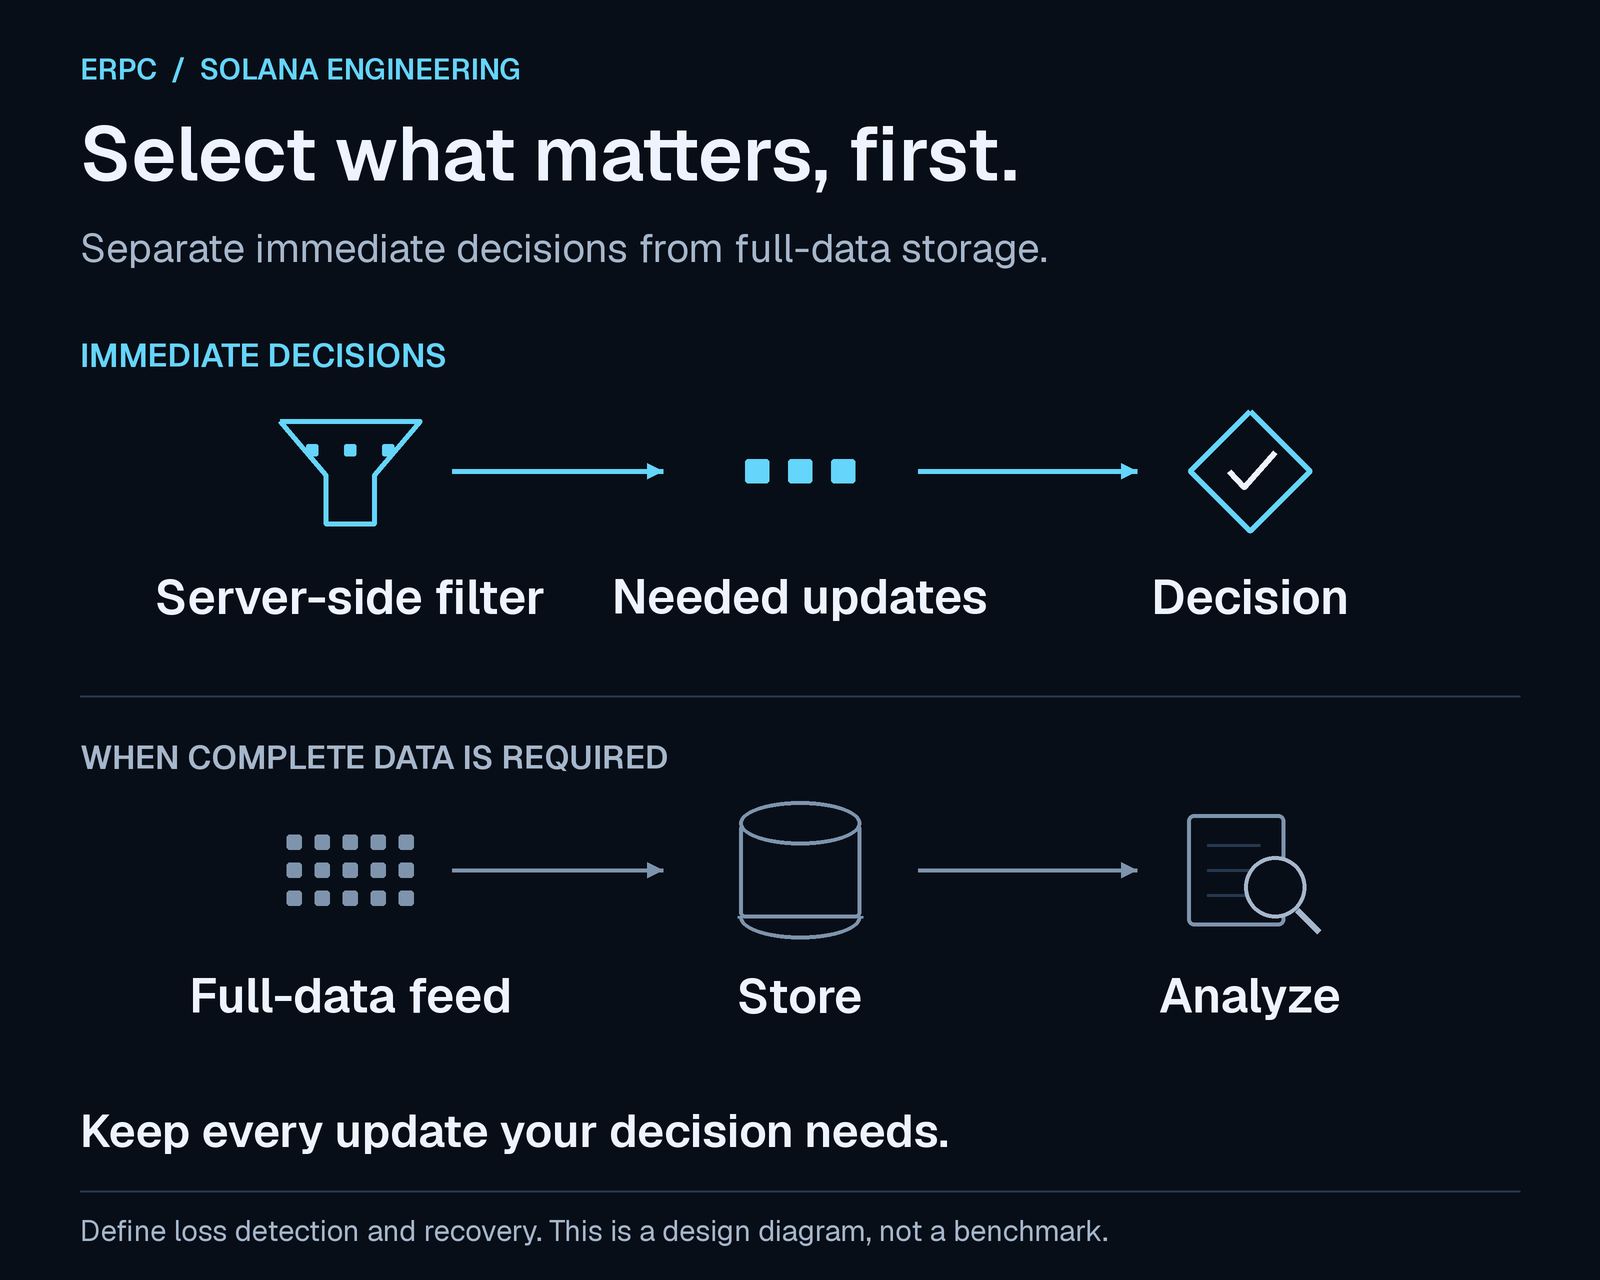
This diagram illustrates an architectural approach. When narrowing subscriptions, define both the information required for a decision and how to recover from missing data.
Myth 7: If data is arriving, processing must be keeping up
A queue can form between data being received and data being processed into a state that can support a decision. If incoming work continuously exceeds processing capacity, lag accumulates even while the connection remains open. A larger buffer can absorb temporary bursts, but with a sustained processing shortfall, it simply holds more old data.
Do not measure only the number of received events. Also measure completed processing, queue length, the age of the oldest unprocessed item, and the time from receipt to the end of a decision. Monitor connection health and data freshness separately.
Keep only the work necessary to maintain reception in the receive loop. Consider separating database writes, full-payload logging, external API calls, and heavy computation into other processing paths. Give queues a capacity limit and a policy for what happens when they are full. A bounded queue can still make upstream work wait once it fills; it does not resolve insufficient processing capacity by itself. [10]
For updates where only the latest state matters, it may be possible to coalesce older states. Transaction events that require ordered or complete processing must not be discarded indiscriminately. Design gap detection, replay, and state recovery after reconnection according to the application's requirements.
ERPC's
STREAM_GUARD_SLOW_READER is a protective response to insufficient write progress or observed delivery lag. Do not use that observation alone to assign a cause. Investigate the connection, host, subscription volume, and the application's consumption rate. Before reconnecting, retain the first status, message, metadata, and trailers when available, then read the reason and retry conditions provided by the server. Resending the same rejected request without correcting it leaves the cause in place. [7]Myth 8: A fast ping or average means the application is fast when it matters
Ping provides an indication of network round-trip time. It measures a different interval from application latency, which includes processing at the source, subscription content, receive waiting, decoding, and decision-making. An average can also hide a small number of substantial delays.
p50 is the median. p95 and p99 mark the points at which 95% and 99% of measured values fall at or below that value. p99 is not the maximum. Include the sample count and measurement period, and check values during bursts of events, maximums, timeouts, disconnects, and missing data. [11]
When comparing providers, match the same event, data type, commitment, and subscription conditions. Where possible, receive on the same measurement host, and use a monotonic clock for elapsed time within the application. When subtracting timestamps from different hosts, account for clock differences that may contaminate the measurement.
Keeping only successful events can make a configuration with frequent missing data appear fast. Choosing the fastest single result and choosing a configuration that is less likely to fall behind when production needs it are different decisions.
Myth 9: The earliest data is equally final and means the same thing
Shreds, transaction notifications, account updates, and block notifications do not represent the same information at the same stage. Using earlier-stage data may leave more reconstruction or interpretation for your application to perform. A comparison needs to align not only receipt time but also what can be known at that point. [8][12]
Distinguish Solana's
processed, confirmed, and finalized commitment levels as well. If early observations inform decisions, the application needs to check its confirmation state later and correct its state when necessary. Separate receiving an early update from the conditions for taking a definitive action in an external system. [13]For example, simply comparing notifications received at different commitments and saying one is a certain number of milliseconds faster does not compare the same work. Determine the information and finality your application requires, then measure how long it takes to become ready to decide under those conditions.
Myth 10: A successful submission means the transaction executes first
A successful
sendTransaction response means that the RPC accepted the transaction. It does not guarantee processing or confirmation by the cluster. The Solana specification explicitly calls for checking the signature's status separately. [14]Even if incoming information supports an early decision, the submission path, blockhash validity, contention on writable accounts, compute resources, priority fees, and the transaction's own success conditions still matter. SWQoS concerns admission and connection priority toward the leader, while priority fees affect scheduling priority. Their roles differ, and neither unconditionally guarantees execution order or success. [15][16]
Record decision completion, submission start, RPC acceptance, execution results, and the required confirmation state separately. When retrying, also distinguish resending a transaction with the same signature from constructing a new transaction, so that the application avoids unintended duplicate actions.
Only when you can observe the entire path from receipt to confirmation can you identify which improvement will bring you closer to your objective.
Measurements to establish first
You do not need to apply every optimization at once. Begin by recording the following under consistent conditions so that you can judge the effects of a change.
| Stage | What to record | What it helps identify |
|---|---|---|
| Network and reception | Actual receive throughput, retransmissions and loss, arrival differences for the same event | Routing, bandwidth, and receive-setting constraints |
| Application | Received and completed counts, queue length, age of the oldest item | Sustained processing shortfalls and accumulated stale data |
| Time to decision | p50, p95, p99, and maximum time from receipt to decision completion | Expensive work and delays during bursts |
| Submission and confirmation | Submission start, RPC acceptance, signature status, execution errors | Delays and failures after receipt |
| Comparison conditions | Region, host, SDK and version, subscription, commitment, period and sample count | Apparent differences caused by different conditions |
Keep a baseline, then verify one change at a time according to the symptoms: subscription scope, separation of processing, client settings, and placement or resources. If you widen a window, also check for increased memory use and backlog. If you narrow a subscription, check that required information has not been lost.
The p99 of total time is not calculated by simply adding the p99 of each stage. Calculate it from the total time for each matched event, and use stage measurements to locate causes. Test during actual bursts of events as well as under average load.
ERPC prepares the infrastructure so developers can refine their logic
When networks, servers, data delivery, and clients are chosen separately, waiting can remain between them even if each has good specifications. ERPC brings Solana data delivery and processing environments onto one platform, reducing the work developers otherwise repeat to select placement and resources from scratch.
Its SUPER VPS and Premium VPS offerings specify high-clock configurations and resource allocation without overcommitment, while Bare Metal provides a physically dedicated machine. ERPC brings networks and servers close to its delivery environment and prepares CPU, memory, storage, and connectivity for sustained processing. Specific specifications are available for each plan and region. [17][18]
| Common development obstacle | Infrastructure and information available through ERPC | What to refine in the application |
|---|---|---|
| Distance that city names cannot reveal | Regional and network configurations that let you choose delivery and processing environments together | Measure arrival times and variation under your subscription conditions |
| Resource contention and sustained performance | High-clock SUPER VPS and Premium VPS without overcommitment, and dedicated Bare Metal | Identify expensive work and sequential processing |
| Data volume and connection method | gRPC, Shreds, RPC, and shared or dedicated options suited to the workload | Define the events and fields required |
| Receive settings and troubleshooting | Solana Stream SDK, configuration examples, filter documentation, and error-specific FAQs | Verify effective settings, queues, reconnection, and recovery |
ERPC helps developers move forward with infrastructure selection and tuning, leaving more time to develop what to observe, which information to use for decisions, and when to submit. With an appropriate service and placement, aligning subscription volume with processing capacity turns infrastructure performance into application speed.
Start by deciding which information your decisions actually require. Receive it early, process it without unnecessary waiting, and verify the outcome. ERPC will continue providing the environment and information to support that improvement.
Implementation resources
- ERPC gRPC FAQ: https://erpc.global/en/faq/grpc/general/
- Subscription filters and current Shared limits: https://erpc.global/en/doc/geyser-grpc/filter/
- gRPC implementation best practices: https://erpc.global/en/doc/geyser-grpc/best-practices/
- Solana Stream SDK: https://github.com/ValidatorsDAO/solana-stream
- ERPC VPS: https://erpc.global/en/vps/
- ERPC Bare Metal: https://erpc.global/en/baremetal/
- ERPC Dashboard: https://dashboard.erpc.global/
- Validators DAO official Discord: https://discord.gg/C7ZQSrCkYR
Technical references
- RIPE IPmap, visualizing routing inefficiencies: https://ipmap.ripe.net/
- AWS, instance network bandwidth: https://docs.aws.amazon.com/AWSEC2/latest/UserGuide/ec2-instance-network-bandwidth.html
- Linux Kernel, CPU Performance Scaling: https://docs.kernel.org/admin-guide/pm/cpufreq.html
- Node.js, avoiding event-loop blocking: https://nodejs.org/en/learn/asynchronous-work/dont-block-the-event-loop
- IETF RFC 9113, HTTP/2 flow control: https://httpwg.org/specs/rfc9113.html#FlowControl
- gRPC, Flow Control: https://grpc.io/docs/guides/flow-control/
- ERPC, receive settings, slow readers, and retries in the gRPC FAQ: https://erpc.global/en/faq/grpc/general/
- Yellowstone gRPC, subscription and filter specifications: https://github.com/rpcpool/yellowstone-grpc
- ERPC, current Shared filter rules: https://erpc.global/en/doc/geyser-grpc/filter/
- Tokio, queues and backpressure: https://tokio.rs/tokio/tutorial/channels
- AWS CloudWatch, percentile definitions: https://docs.aws.amazon.com/AmazonCloudWatch/latest/monitoring/Statistics-definitions.html
- ERPC, Shreds UDP Forwarding: https://erpc.global/en/doc/shredstream/udp-forwarding/
- Solana, Transaction Confirmation & Expiration: https://solana.com/developers/cookbook/transactions/confirmation
- Solana, sendTransaction: https://solana.com/docs/rpc/http/sendtransaction
- Solana, Stake-weighted Quality of Service: https://solana.com/docs/defi/stake-weighted-qos
- Solana, transaction fees: https://solana.com/docs/core/fees
- ERPC, VPS configurations and specifications: https://erpc.global/en/vps/
- ERPC, Bare Metal configurations and specifications: https://erpc.global/en/baremetal/